¶ Output
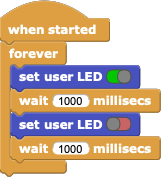
set user LED

Turns on or off the middle LED in the first row of the display (or a simulated LED on boards with TFT displays). The boolean switch at right edge can be true (green) or false (red). If true, the LED will be turned ON, and if false, the LED will be turned OFF.
say

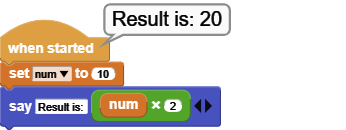
Will display a bubble with the value entered into the field. It can be used to display any of the data types supported by MicroBlocks. In addition to directly entering values into the field, one can place there a variable reporter block as well. If more than one piece of data is to be displayed, simply click on the white triangle to open up additional fields. This is one of the main ways to help troubleshoot code written.
The result of the num variable multiplied by 2 is displayed with SAY.
graph

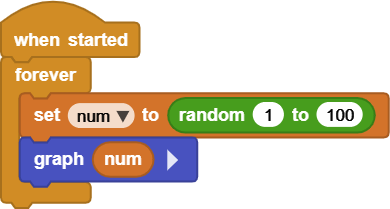
Will graph the value entered, in the data graph display panel. Any kind of data can be graphed: numbers, digital and analog pin values, sensor outputs, etc. If more than one data field is to be graphed, click on the white triangle for additional data fields. Up to six simultaneous values can be graphed with different colors.
NOTE: graphing is only supported in the IDE. As such, it is only possible to graph while the micro device is connected to the computer. Attempting to graph while not attached to the PC will result in "Board not connected" message being displayed.
Graph block is displaying a graph of the random numbers 1-10 plotted endlessly. The graph y-axis has been adjusted to the bottom position using the graph options menu.
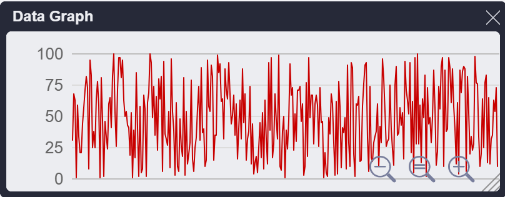
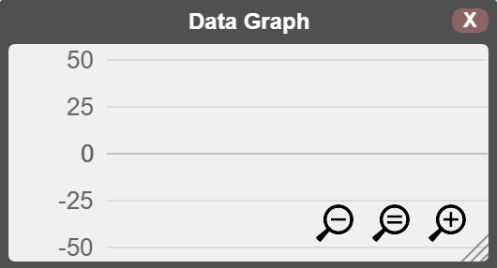
As mentioned above, data graph panel displays values used with the graph block. Panel's y-axis can be scaled using the zoom controls, and the x-axis will scroll sideways as more data is graphed.
The graph display window can be resized with the control at the bottom right corner of the graph window. The window itself can be positioned anywhere on the IDE surface.
After recording of any data, the graph display window can be closed and opened, if needed, without the loss of any data or the image displayed. Also, it is possible to disconnect and reconnect the micro device in use, without losing the graph data.
Various graph related options can be controlled via the graph options menu. It is displayed when one right-clicks the graph panel.
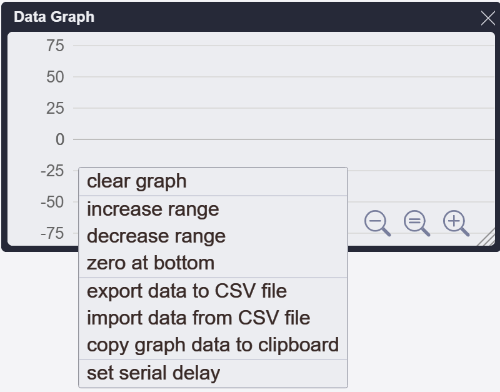
Graph options menu allows control of axis display, as well as data import/export, and setting of the data sampling rate.
increase range
Zooms out the graph display area, showing less detail but more of the graph's extents.
decrease range
Zooms in the graph display area, showing more detail but less of the graph's extents.
zero at bottom
Places the y- axis origin point at the bottom of the graph display area.
export data to csv file
enables saving the graph data in csv format. The file is saved on the PC that MicroBlocks is running. Only the last 10000 values are exported.
import data from csv file
enables loading csv data from the PC that the MicroBlocks is running. The imported data is graphed and displayed in the graph panel. Only 10000 values will be imported.
copy graph data to clipboard (advanced feature)
Data used with the graph block is copied to the clipboard. Only the last 10000 values are copied.
set serial delay (advanced feature)
Sets the data sampling rate between 1 and 25ms. Lower numbers result in higher sampling rates.
clear graph

Deletes all graph data and clears the graph window.
