¶ Overview
This experiment illustrates the fact that an object in free fall does not experience the tug of the Earth's gravity -- that is, the "G forces" on the object are zero.
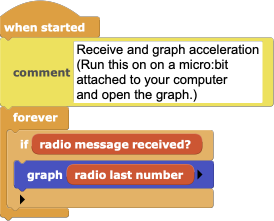
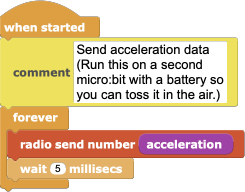
It uses two micro:bits. One micro:bit, equipped with a battery, sends acceleration data via radio. A second micro:bit, attached to a computer, receives and graphs that data as the first micro:bit is tossed in the air and caught.
¶ Scripts
| Receiver Script | Sender Script |
|---|---|
 |
 |
¶ Process
Plug in a micro:bit. Build the sender script above. You can also download and open the FreeFall project then delete the receiver script. Unplug the micro:bit and attach a battery pack to it. This is the sender micro:bit.
Plug in the other micro:bit. Build the receiver script above. You can also download and open the FreeFall project then delete the sender script. Open the graph and start the script. Data from the sender micro:bit should appear in the graph. (If it doesn't, make sure that there is a battery pack attached to the sender micro:bit, that the batteries are good, and that the switch on the battery pack, if there is one, is turned on.)
Now try some experiments. Shake the sender micro:bit, hold it still, and rest it on a table without moving it. What do you notice about the values being graphed?
To explore free fall, gently toss the micro:bit into the air and catch it. If you're not sure you can catch it, you can do this experiment over a bed or a pillow, or you can wrap the micro:bit in cloth or bubble wrap to protect it in case it lands on the floor.
¶ Discussion
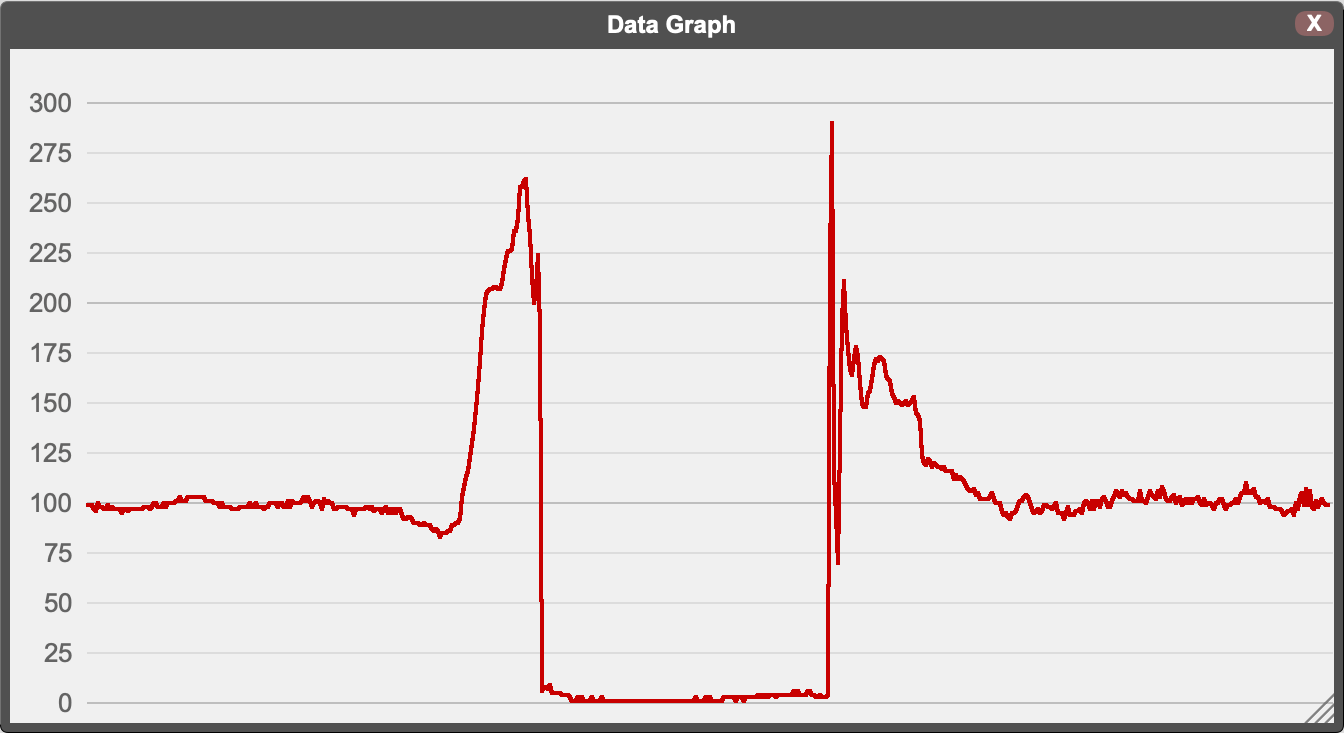
You may get a graph like this:

Notice that the left side of this graph is nearly flat with values hovering around 100. That shows the gravitation pull of the Earth on an object at rest on a surface. In this case, the surface was the palm of my hand which I was trying hold still.
To the right of that flat area is a peak in the graph of around 250. That's the acceleration as I tossed the micro:bit into the air.
That peak is followed by a flat section that is close to zero. That part of the graph shows the G-forces the micro:bit experienced as it flew through the air. First the micro:bit traveled up, gradually slowing down until it got to the highest part of the toss, then it started falling, speeding up as it fell. During that entire time, it was in "free fall", meaning that it wasn't feeling the pull of Earth's gravity at all.
At the end of that flat period the graph suddenly jumps up to about 300. That was when the micro:bit landed in my hands. After wiggling up and down a bit, the graph returns to 100 as I recovered from the catch and held the micro:bit still again.
Your graph might not look much like the one above. It took me several tries to get that graph. Sometimes I didn't hold the micro:bit still enough before or after the toss, and one time the micro:bit actually hit the ceiling creating a spike in the graph (oops!).
However, the thing that makes the most difference in achieving close to zero in the flat part of the graph is to make sure that the micro:bit doesn't spin as you throw it. If it spins, it generates its own pseudogravity ("centripetal force"), just like a spinning space station does.